
buy Volume I at amazon
this chapter is taken from Volume II (to be published 2027)
War Deaths Scale Faster than the Population Density
My town’s population never changes. Every time a girl gets pregnant, a guy leaves town. –Faron Young
In my mind I can picture a world without war and a world without hate. I can also picture us attacking that world. –Jack Nicholson
Nuclear war is like bankruptcy. It happens gradually, then suddenly. –Ozmioz
Another main event. As we will get to, the data shows war deaths scale faster than population density. First some perspective. In the 1940s, Lewis Richardson came to the conclusion that war deaths scale linearly with population, giving a scaling exponent of 1. However, looking at effectively the same data, in 1974 Volney Stefflre concluded that for every doubling of the world’s population, the number of war deaths increased 10-fold. This gives a scaling exponent of 3.3. Who’s correct? The root cause of the confusion is they didn’t look at enough data. A range of 150 to 300 years is insufficient. At this point it might be good for the reader to go back to the “Power-Law Data Summary” chapter and take a second look at Max Roser’s war-death trend data
As discussed in the chapter on “Pareto Simulations”, what is complicating the analysis is the Pareto exponent for war deaths, alpha_deaths, is 0.6. Since alpha_deaths is less than 1, the mean number of war deaths per century depends on the size of the largest war. This number fluctuates significantly from century to century.
However, alpha_deaths being 0.6 simplifies the analysis somewhat. The top six bloodiest wars account for 80% of the war deaths for a given time period. Thus, we only have to count the bloodiest wars to get an accurate death toll estimate.
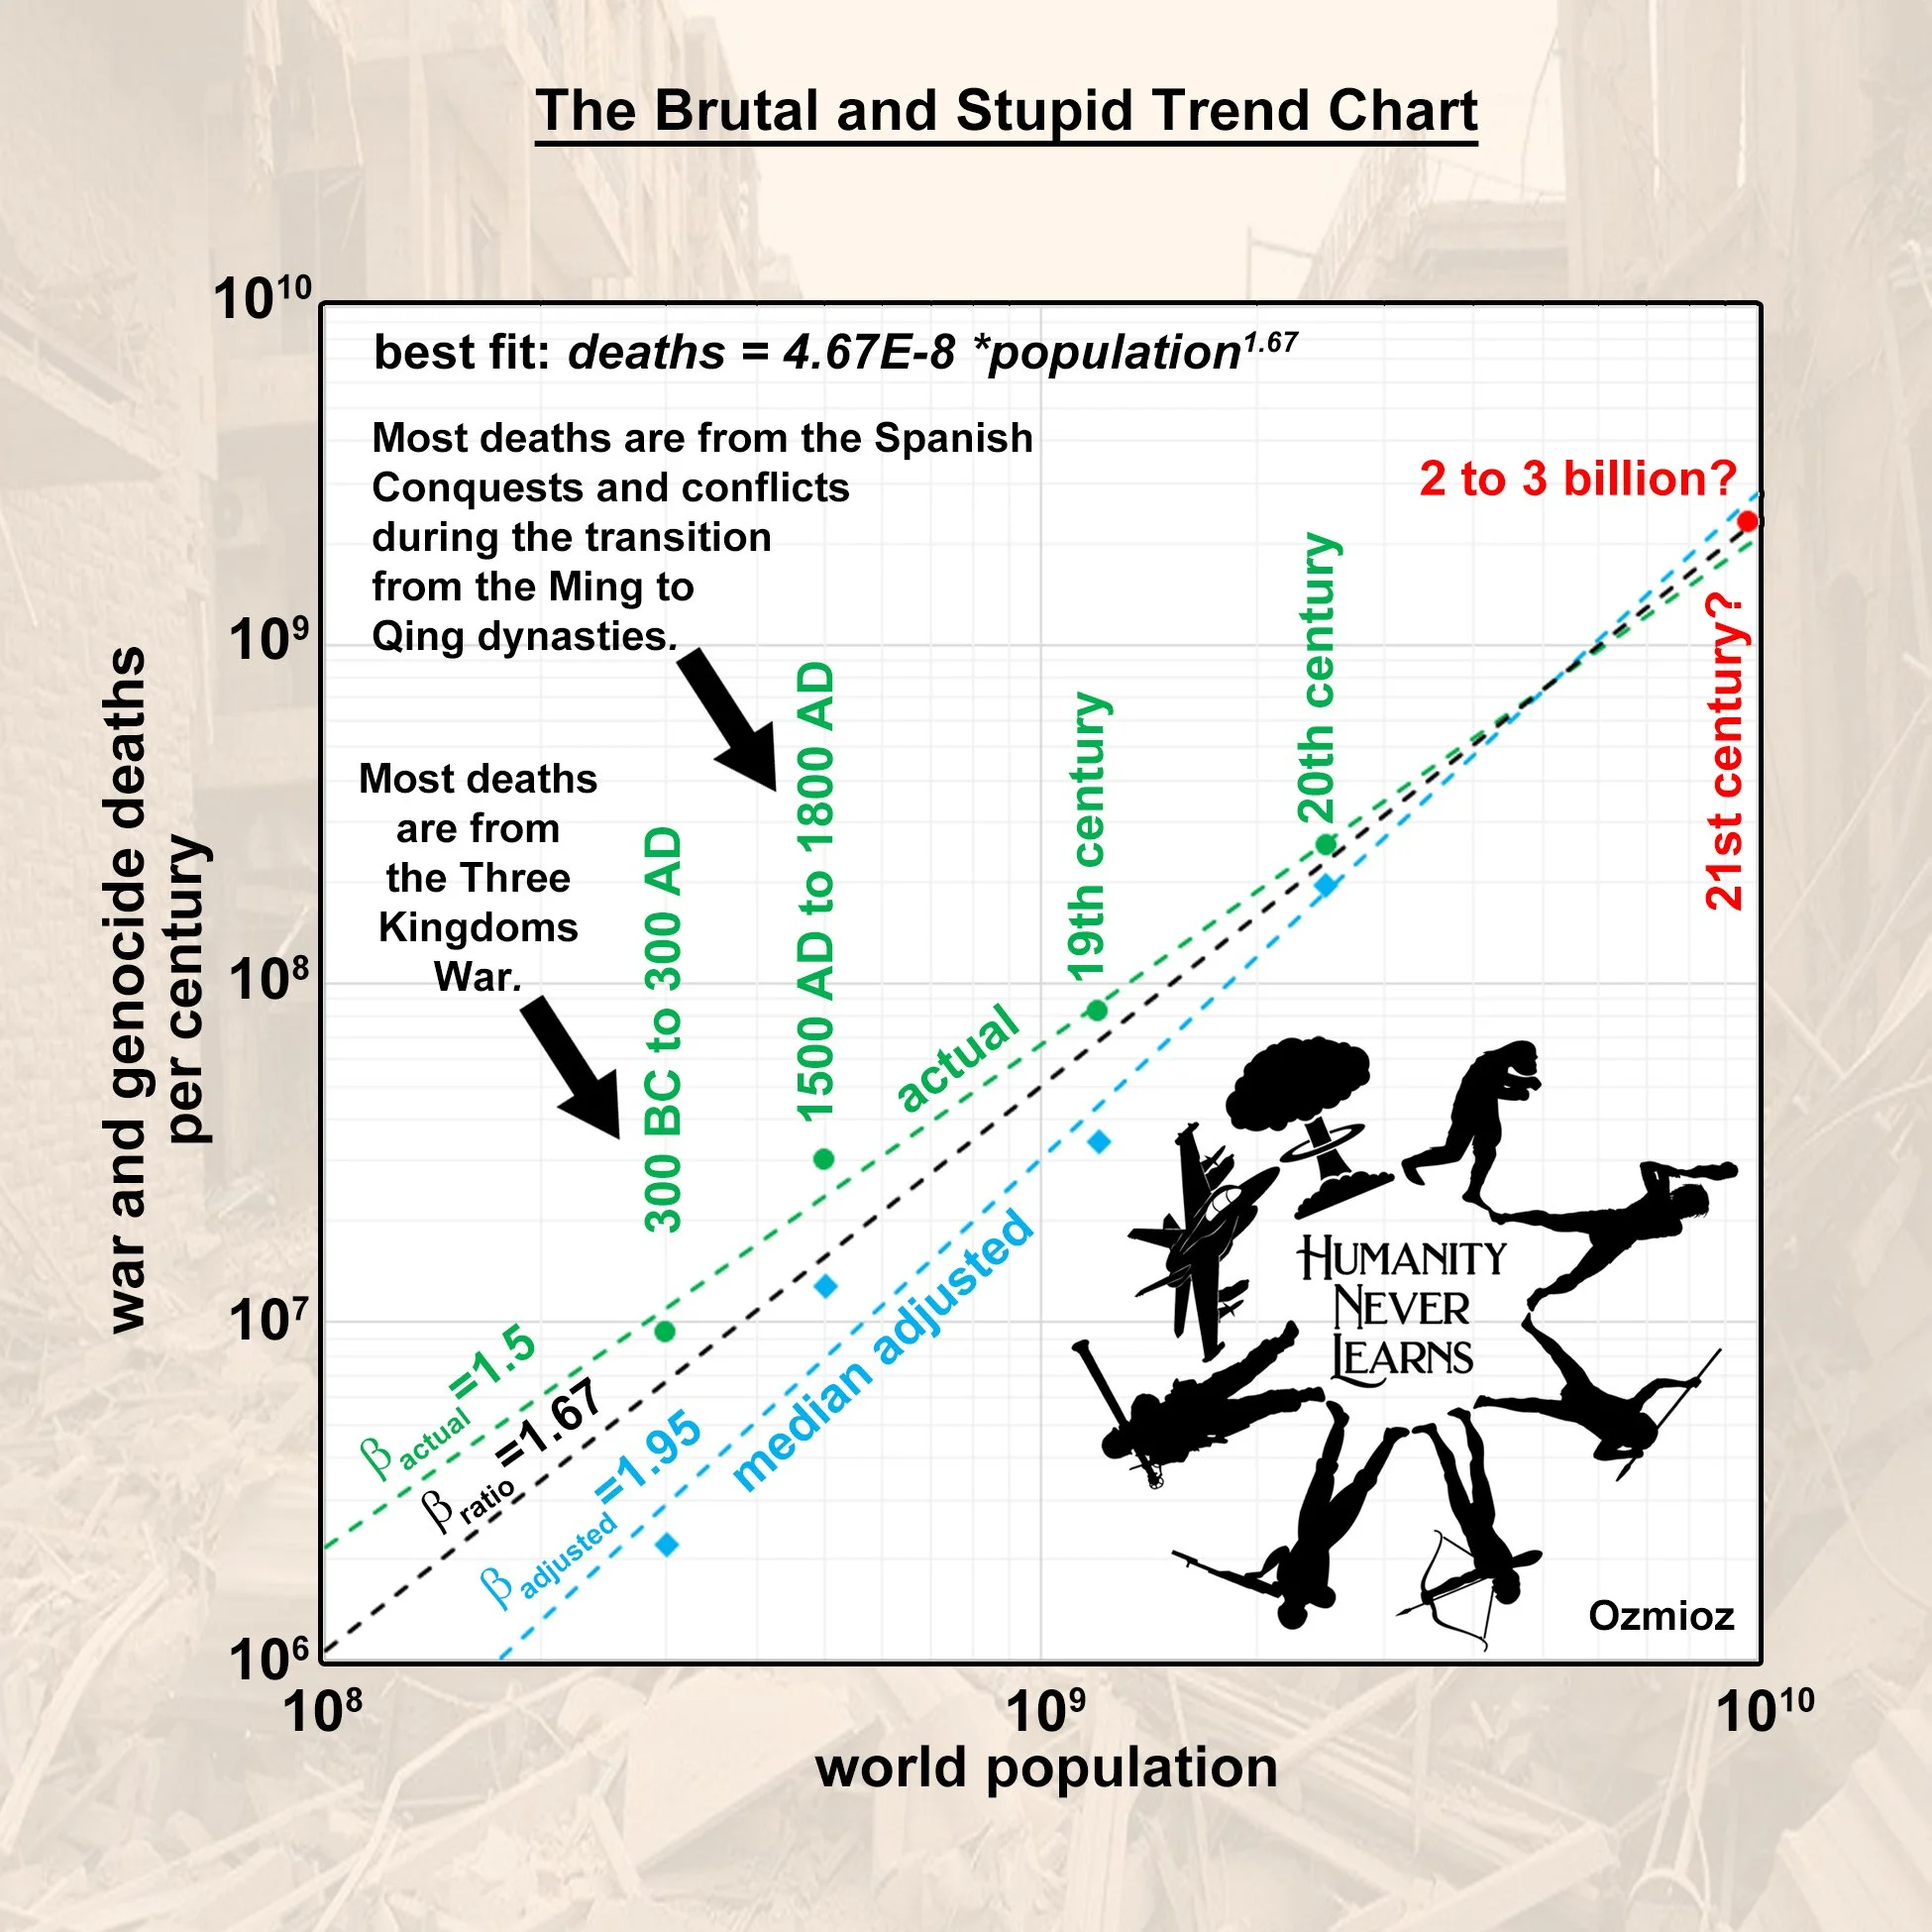
Our war and genocide data, and our median adjusted data, are summarized in the chapter on “Pareto Simulations”. These data are plotted in the figure. Best fits give scaling exponents of beta_actual = 1.5 and beta_adjusted = 1.95. Unfortunately, both fits predict about 2.5 billion war deaths for the 21st century.
As discussed in the footnote, we believe a more sophisticated ratio method is a better way to extract the scaling exponent from the data. This method gives a scaling exponent of 1.67, which falls between 1.5 and 1.95. Unfortunately, there is something scarily implicit within the ratio method. We will get to that in the next chapter. It is also worth noting that as discussed in the “Pareto Simulations and Median Adjusted Numbers for War Deaths” chapter, a scaling exponent of 1.67 is consistent with a Pareto exponent of 0.6 if the “number of war-like events” scales linearly with the population, which is a reasonable assumption. It is a reasonable assumption because over the course of an average person’s life they will make X strategic decisions that lead to partnerships and Y strategic decisions that result in competition and conflict.
On a sadly silly sarcastic note, these scaling arguments also give the human population for total war. If the Earth’s population reaches roughly 100 billion then everyone will start killing each other all the time. Probably because of traffic jams and road rage. Seriously though, it is estimated 1 square mile is needed to feed 200 people. Thus, all of Earth can roughly feed about 40 billion people. For the purposes of this silly extrapolation, 40 billion is close to 100 billion to within uncertainties. It is as if our war-like behaviors instinctively know when resources will run out. It might be a coincidence, but this is a little creepy. Actually, it is a lot creepy. As Yogi Berra said, “It is too coincidental to be a coincidence.” This suggests people are instinctively friendly until they are instinctively not.
On another silly note, our best fit predicts if the world’s population is only 1 million then the number of war deaths per century is 500, which sounds about right. These deaths are most likely due to bar brawls over females.
Finally, if we ignore the 16th and 17th centuries, and only look at the 18th, 19th, and 20th centuries, fitting the data gives a scaling exponent of 2.7, which is close to Volney Stefflre’s estimate of 3.3. Again, it is worth pointing out there are large fluctuations from century to century because alpha_deaths is 0.6. Volney Stefflre’s estimate of 3.3 is too high because the 18th century was unusually peaceful. Great care is required when looking at a single time period.
The takeaway is every generation must relearn the mistakes of their ancestors. Unless something changes, a generation in the not so distance future appears bound to make the biggest mistake in all of human history.
Footnote: We believe there is a better way to extract the scaling exponent from the data. As we discussed in the chapter “Countries follow Zipf’s Law”, if two variables scale as x = c * y^beta, and both follow a Pareto distribution with Pareto exponents alpha_x and alpha_y, then beta = alpha_y / alpha_x. If we make the assumption that wars are fought between countries then we can use this relationship. From earlier, we have alpha_population = 1 for country’s population, and alpha_deaths = 0.6. This predicts war_deaths = c’ * population^1.67. In fact we put more faith in this ratio estimate than the one given above primarily because it is cleaner, and as discussed in the chapter “Brutal and Stupid Power-Law for All of Humanity”, alpha_deaths shows little to no change with time period.